Low end problems are the reason a home office studio can sound “fine” on headphones and still fall apart on speakers. If you want mixes that translate, you need to know how your room is bending the bass, not guess based on vibes.
The good news is that learning how to measure bass response in a room is easier than people make it, and you can do it in an hour. The bad news is that sloppy measurements waste that hour, so repeatability matters more than fancy graphs.
This article walks through a simple method using a room sweep, a measurement mic, and a couple of views like a waterfall graph to confirm what your ears already suspect. The goal is a routine you can repeat every time you move a desk, add a bass trap, or change monitor placement.
What you’re measuring: level vs decay vs consistency
Bass response is not one thing, it is level, decay time, and how stable the response is across small position changes. If you only look at level, you can “fix” a peak and still have a room that booms for half a second after every kick drum hit.
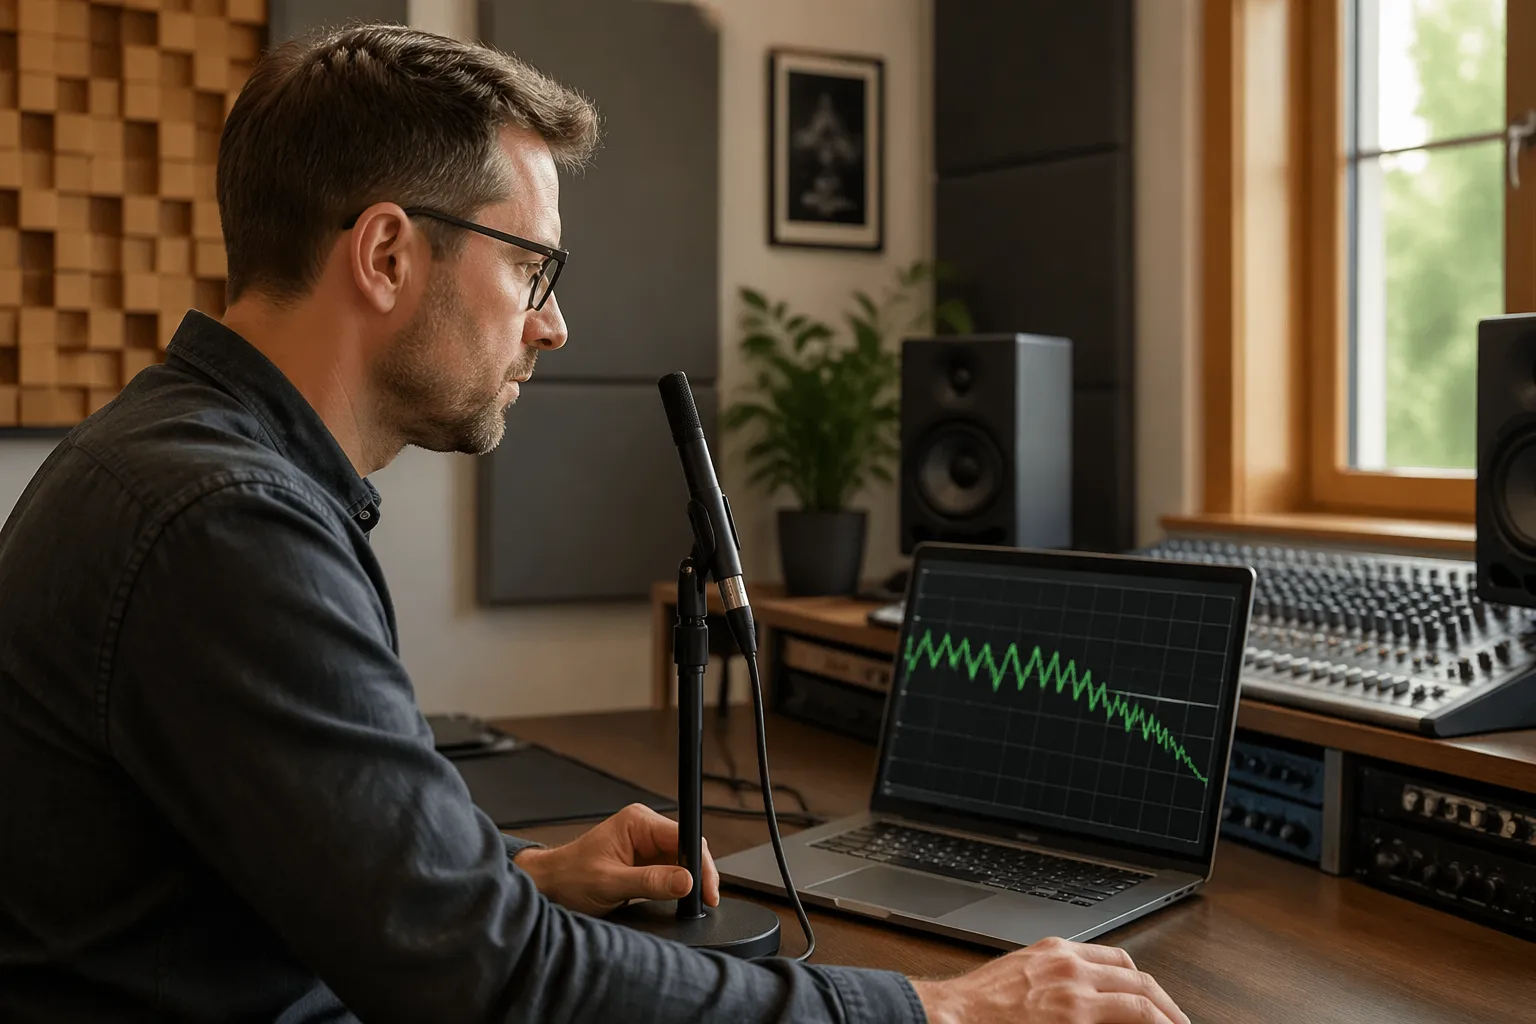
Level is the frequency response curve, the up and down line that shows peaks and nulls. In a small home office, those bumps are mostly room modes, not your speakers being “bad at 70 Hz.”
Decay is how long energy hangs around at each frequency after the sweep stops. Long decay at one frequency sounds like one-note bass, and it is often the real reason the low end feels slow or cloudy.
Consistency is the part most people skip, and it matters because your head moves when you work. If a 90 Hz null appears when you lean back two inches, your measurements should show that instability so you stop chasing a single perfect curve.
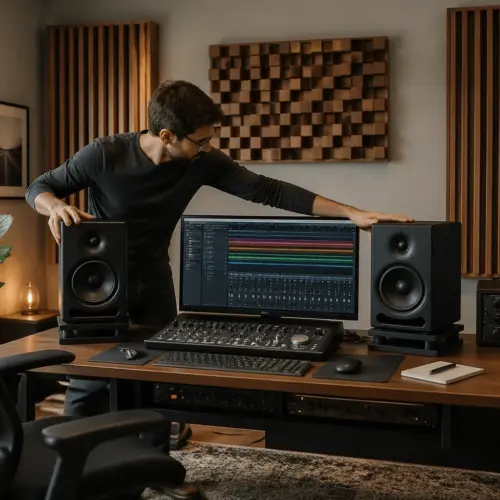
Minimal gear setup for reliable bass measurements
You do not need a rack of gear, but you do need a measurement mic with a calibration file and an interface that can power it. A USB mic like a miniDSP UMIK-1 works great, and an XLR mic like a Behringer ECM8000 can work if you know its limits.
Room EQ Wizard is the standard tool because it is free and it does the sweep, the analysis, and the waterfall graph in one place. If you use a different app, the process is the same, but REW tutorials and troubleshooting are everywhere.
A mic stand is not optional if you want repeatable results, because handholding changes the response and adds rustle noise. Use a boom arm stand so you can put the capsule exactly where your head is without the stand blocking the speaker path.
For home office studios, closed windows and a quiet HVAC setting matter more than people admit. Low frequency noise from traffic or a computer fan can smear the bottom of the measurement and make you think your room has a hump that is really just rumble.
Running a sweep and capturing clean results
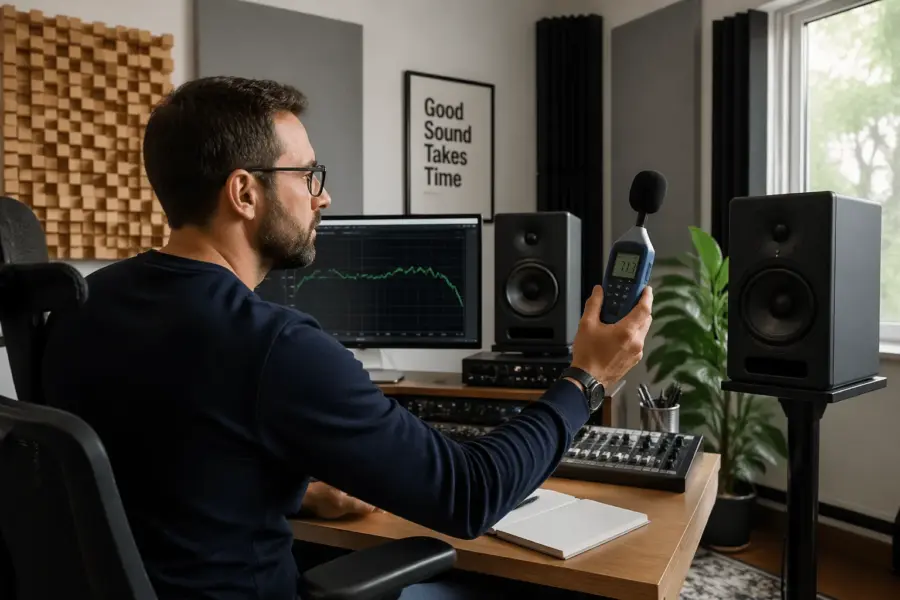
A room sweep is a controlled signal that slides through frequencies so the software can map what the mic hears at each point. To keep the data clean, you want one speaker at a time, a stable mic position, and a level that is loud enough to rise above noise but not so loud it clips.
Start with your listening position, place the mic capsule where your nose would be, and point it where the calibration file expects, usually straight up for many mics. Run the sweep from 15 Hz to 300 Hz for bass work, then save the measurement with a name that includes date, speaker, and setup notes.
| Setting | Good starting value | Why it helps |
|---|---|---|
| Sweep range | 15 Hz to 300 Hz | Focuses on modes and boundary effects without clutter |
| Sweep level | 75 to 85 dB SPL at the mic | Beats room noise while staying safe and clean |
| Speaker testing | Left only, then right only | Separates room issues from stereo interactions |
| Timing reference | Acoustic timing in REW | Improves alignment and makes comparisons tighter |
| Smoothing | 1/12 octave for bass | Shows real structure without hiding narrow nulls |
Reading peaks and nulls without getting lost in graphs
The first graph you will stare at is frequency response, and it can look ugly in a small room. Ugly is normal, so the job is to identify the big movers, not to panic about every ripple.
Peaks usually come from boundaries and modes stacking up, and they often respond well to bass trapping and small placement changes. Nulls are cancellations, and deep nulls often laugh at EQ because boosting the speaker just boosts the cancellation too.
When you see a deep dip like 15 dB down around 80 Hz, move the mic forward and back a few inches and measure again. If the null shifts a lot, it is position sensitive and you should prioritize speaker and listening position geometry before buying more panels.
Keep your eyes on the 30 to 200 Hz region where most home office rooms misbehave, and ignore the temptation to chase a ruler flat line. A response that is within about plus or minus 6 dB with reasonable decay is workable, and many famous control rooms are not “flat” in the way forums demand.
Using decay and waterfall views to spot ringing
Frequency response tells you what is loud, but the waterfall graph tells you what refuses to stop. If a frequency ridge hangs out past 300 ms in a small room, you will hear it as lingering bass, even if the level graph looks acceptable.
In REW, set the waterfall window so you can see at least 500 ms of decay and focus on the 20 to 200 Hz range. Use a consistent dB range and the same time span each time, because changing the view can make the room look “fixed” when it is not.
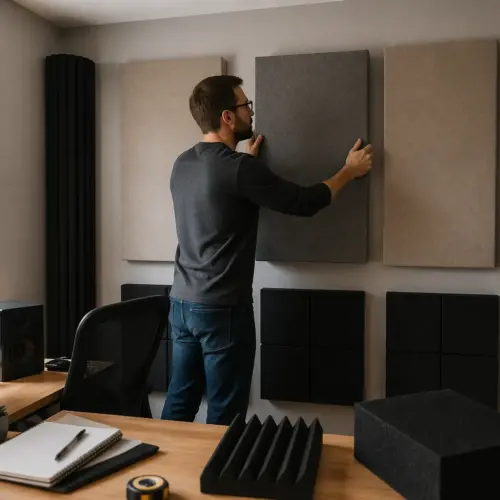
Ringing often shows up around the lowest axial modes, like 40 to 70 Hz in many bedrooms and small offices. Those are the spots where corner traps, thick rear wall absorption, and sometimes a tuned solution can make a bigger difference than swapping monitors.
If you see a narrow ridge that lasts forever, check for sympathetic rattles too, like a closet door or a desk drawer. A measurement mic will happily report that buzz as “decay,” so fix the mechanical noise before you blame the room.
A before-and-after workflow for treatment changes
If you change three things at once, you will not know what helped, and you will end up second guessing everything. Treat measurements like lab notes, one change, one new sweep, and one clear label in your file list.
Start with a baseline session that includes left, right, and both speakers, plus a few mic positions around the listening spot. That small “cloud” of measurements shows consistency, and it keeps you from optimizing for a single point in space.
When you add treatment, re-run the exact same room sweep set at the same volume and mic height. If you cannot recreate the setup, take photos and mark the mic stand position with tape on the floor.
The win condition is not perfection, it is fewer extreme peaks, shallower nulls at the listening position, and shorter decay at the worst frequencies. If a change makes one frequency prettier but worsens decay, I usually call that a sideways move and keep experimenting.
Common measurement mistakes that make bass look worse than it is
The fastest way to ruin a measurement is to clip the input or output, because distortion shows up as fake low frequency energy. Watch your interface meters, watch REW’s level check, and back the volume down if anything hits red.
Another common mistake is measuring with both speakers first and assuming the curve is “the room.” Stereo interference creates combing and extra cancellations, so you need left and right sweeps to see what each speaker is doing in the same geometry.
People also forget that mic placement is a measurement, not a suggestion, and moving it even an inch changes the low end. If you want to compare before and after, you have to treat the mic position like a fixed reference point.
Finally, do not use heavy smoothing like 1/3 octave when you are trying to learn how to measure bass response in a room. Heavy smoothing hides narrow nulls that you will still hear, then you wonder why the “fixed” room still has missing notes.
Quick checklist for a repeatable measurement session
Repeatability is boring, and boring is exactly what you want when you are troubleshooting bass. A tight routine means your graphs reflect the room, not your process changing every time.
This checklist keeps you honest and speeds up the session once you have done it a few times. Use it before each sweep set, especially when you are testing treatment placement.
- Mic on stand, capsule at ear height
- Calibration file loaded for the measurement mic
- One speaker at a time, then both
- Sweep range set to 15 Hz to 300 Hz
- Level check done, no clipping on input or output
- Same smoothing choice, like 1/12 octave
- Files named with date, speaker, and change notes
Interpreting results in terms of studio geometry
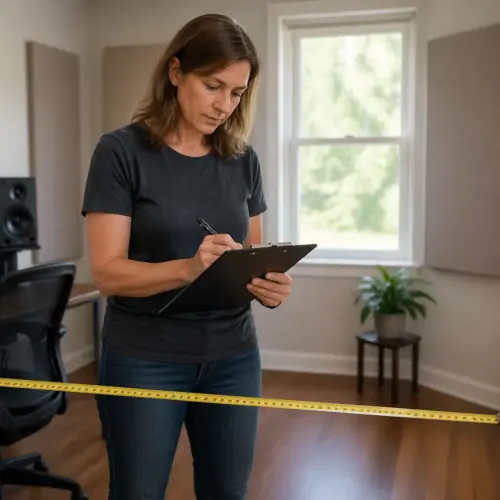
Graphs are only useful if they push you toward a physical change, and studio geometry is the first lever to pull. Where the desk sits, how far monitors are from the front wall, and where your chair lands relative to the room length all show up in the bass plot.
If your listening position is centered front to back, you often sit in a big modal null, and the response will show missing low end around one of the length modes. Sliding the chair forward or back by 6 to 12 inches can change the curve more than a plug-in EQ ever will.
Monitor distance to the front wall affects speaker boundary interference, which often creates a dip somewhere between 80 and 200 Hz depending on distance. If you measure a stubborn null in that region, try moving the monitors closer to the wall in small steps and re-measure.
Side wall distance matters too, especially if one speaker is closer to a wall because of a doorway or shelving. If left and right sweeps look different below 150 Hz, fix the symmetry of placement before you start buying treatment to patch over an uneven layout.
When EQ helps and when it makes you chase your tail
EQ is great for trimming broad peaks, and it is terrible at fixing deep nulls caused by cancellation. If you boost a null, you burn headroom and you still do not get that note back at your ears.
I like to measure first, treat and place second, then use EQ as the last 10 percent. If your room sweep shows a broad 6 dB hump around 55 Hz that is consistent across small mic moves, a gentle cut can clean it up without side effects.
Use your left and right measurements to decide if the problem is global or speaker specific. If one speaker has a peak and the other does not, EQ on the master bus is the wrong tool, and placement or boundary conditions are the real problem.
After EQ, re-check decay, because some filters change how the system behaves around resonance. The waterfall graph should still look better or at least not worse, otherwise you are trading a prettier line for bass that hangs around too long.
Conclusion
Once you learn how to measure bass response in a room, you stop arguing with your speakers and start dealing with the space. A measurement mic, a consistent room sweep routine, and a quick look at decay views give you evidence you can act on.
Use frequency response to find the big peaks and nulls, and use the waterfall graph to catch ringing that ruins punch and clarity. Then change one thing at a time, measure again, and keep the fixes that improve both level and decay.
Home office studios are small and stubborn, but they are also predictable once you see the patterns. If you can measure repeatably, you can improve repeatably, and your low end will finally stop surprising you on every new system.